図と表を同時にハイライトする
- 12/18, AM11:17 図もクリックできるように追記.
タグはrailsだけど,単にjavasctipt(prototype)+htmlの話.
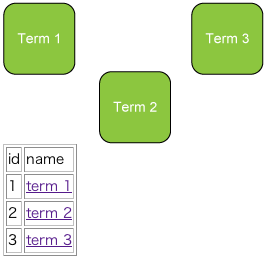
表にある"term2"をクリックしたら,下の様に図と表をハイライトさせるようにする(term1, term3も同様に機能する).


- 図の準備.
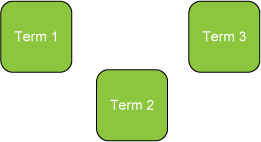
角丸3つが書かれた図を用意します.以下をそれぞれ,baseimage.png,highlight.pngとして,$RAILS_DIR/public/images/ 以下に置きます.


- Javascript+HTML部
(Railsの場合) Viewとして以下のrhtmlを用意します.上から3行目のjavascriptのロードとlink_to_functionがrailsに依存しているだけで,他の部分はrailsに依存していません.prototype.jsを適切に設定して,link_to_functionをonclickで動作するようにすれば動くはずです.
動作原理は,"selected_term"の所で予め画像のハイライト(緑の枠)を作っておいて,かつ,見えないようにdisplayをnoneにしておき,表の"term 2"をクリックしたら(link_to_function),javascriptのtoggleHighlightに飛んで,displayの状態を入れ替える(Element.toggle)と,ハイライトされていなければ,表の背景を白に,ハイライトされていれば黄色にするようにして(if文)います.
図の方は,クリッカブルマップになっていて,図をクリックしたらハイライトの枠をtoggleしています.表をクリックした時と,図をクリックしたときに呼ばれる関数は同じものです.
- 中抜きの枠の作成
中抜きの枠は,色々作り方があるかとは思いますが,ぶるじょあにillustrator の「複合パス」を利用して作成しました.
大きな四角を中に色を塗って作成し,同様に小さな枠を作って,重ねます.
両方を選択して,「複合パス」を選ぶと中抜きになります.
<html>
  <head>
    <%= javascript_include_tag :defaults %>
    <script language="javascript">
      <!--
        function toggleHighlight(imgid,rowid){
	  Element.toggle(imgid)
	  if($(imgid).style.display == 'none') {
            $(rowid).style.backgroundColor='white';
  	  } else {
            $(rowid).style.backgroundColor='yellow';
	  }
        }
      //-->
    </script>
  </head>
  <body>
    <div id="clickablemap" style="position: relative;">
      <img src="/images/baseimage.png" usemap="baseimagemap" border=0>
        <map name="baseimagemap">
	  <area shape="rect" coords="0,0,72,72" onclick="toggleHighlight('highlight_term1','content1'); return false;" href="#" alt="term1"/>
	  <area shape="rect" coords="95,65,167,160" onclick="toggleHighlight('highlight_term2','content2'); return false;" href="#" alt="term1"/>
	  <area shape="rect" coords="190,0,262,72" onclick="toggleHighlight('highlight_term3','content3'); return false;" href="#" alt="term1"/>
	</map>
      </img>
      <div id="selected_term">
        <div id="highlight_term1" style="position: absolute; left:-7px; top: -6px; width:72px; display:none; ">
	  <img src="/images/highlight.png" usemap="highlightmap1" border=0>
            <map name="highlightmap1">
  	      <area shape="rect" coords="0,0,72,72" onclick="toggleHighlight('highlight_term1','content1'); return false;" href="#" alt="term1"/>
	    </map>
	  </img>
        </div>
        <div id="highlight_term2" style="position: absolute; left:89px; top: 62px; width:72px; display:none; ">
	  <img src="/images/highlight.png" usemap="highlightmap2" border=0>
            <map name="highlightmap2">
  	      <area shape="rect" coords="0,0,72,72" onclick="toggleHighlight('highlight_term2','content2'); return false;" href="#" alt="term2"/>
	    </map>
	  </img>
        </div>
        <div id="highlight_term3" style="position: absolute; left:181px; top: -6px; width:72px; display:none; ">
	  <img src="/images/highlight.png" usemap="highlightmap3" border=0>
            <map name="highlightmap3">
  	      <area shape="rect" coords="0,0,72,72" onclick="toggleHighlight('highlight_term3','content3'); return false;" href="#" alt="term3"/>
	    </map>
	  </img>
        </div>
      </div>
    </div>
    <div id="termtable">
      <table border=1>
        <tr id="header">
          <td>id</td><td>name</td>
        </tr>
        <tr id="content1">
          <td>1</td><td><%= link_to_function "term 1", "toggleHighlight('highlight_term1','content1')"%></td>
        </tr>
        <tr id="content2">
          <td>2</td><td><%= link_to_function "term 2", "toggleHighlight('highlight_term2','content2')"%></td>
        </tr>
        <tr id="content3">
          <td>3</td><td><%= link_to_function "term 3", "toggleHighlight('highlight_term3','content3')"%></td>
        </tr>
      </table>
    </div>
  </body>
</html>